Evolution of the number of housing of Le Chambon-sur-Lignon
History of housing of Le Chambon-sur-Lignon from 1968 to 2007 :
The number of housing of Le Chambon-sur-Lignon was 2 064 in 2007, 2 128 in 1999, 2 036 in 1990, 1 951 in 1982, 1 742 in 1975 and 1 690 in 1968.
In 2007 the accommodations of Le Chambon-sur-Lignon consisted of 1 148 main homes, 778 second homes and 138 vacant accommodations.
The following graphs show the history of the number and the type of housing of Le Chambon-sur-Lignon from 1968 to 2007. The second graph is drawn in cubic interpolation. This allows to obtain more exactly the number of accommodation of the city of Le Chambon-sur-Lignon years where no inventory was made.
|
Housing of Le Chambon-sur-Lignon from 1968 to 2007 :
- Housing of Le Chambon-sur-Lignon in 2007 : 2 064
- Housing of Le Chambon-sur-Lignon in 1999 : 2 128
- Housing of Le Chambon-sur-Lignon in 1990 : 2 036
- Housing of Le Chambon-sur-Lignon in 1982 : 1 951
- Housing of Le Chambon-sur-Lignon in 1975 : 1 742
- Housing of Le Chambon-sur-Lignon in 1968 : 1 690
|
Number of housing of Le Chambon-sur-Lignon group by types from 1968 to 2007 :
- Number of main homes of Le Chambon-sur-Lignon in 2007 : 1 148
- Number of main homes of Le Chambon-sur-Lignon in 1999 : 1 088
- Number of main homes of Le Chambon-sur-Lignon in 1990 : 1 015
- Number of second homes of Le Chambon-sur-Lignon in 2007 : 778
- Number of second homes of Le Chambon-sur-Lignon in 1999 : 886
- Number of second homes of Le Chambon-sur-Lignon in 1990 : 855
- Number of vacant housing of Le Chambon-sur-Lignon in 2007 : 138
- Number of vacant housing of Le Chambon-sur-Lignon in 1999 : 154
- Number of vacant housing of Le Chambon-sur-Lignon in 1990 : 166
|
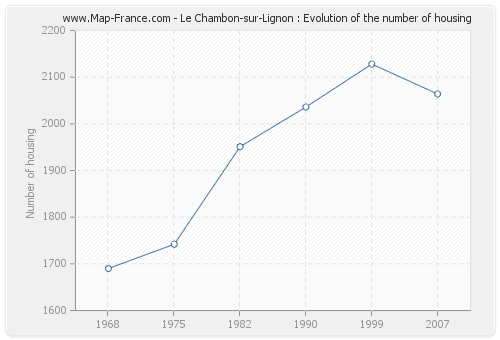
Housing of Le Chambon-sur-Lignon
|
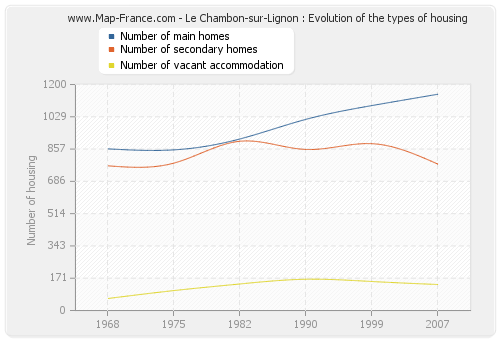
Housing evolution of Le Chambon-sur-Lignon from 1968 to 2007
|
Number of housing of Le Chambon-sur-Lignon per inhabitants
History of the number of housing of Le Chambon-sur-Lignon per inhabitants :
The population of Le Chambon-sur-Lignon was 2 662 inhabitants in 2007, 2 645 inhabitants in 1999, 2 854 inhabitants in 1990, 2 791 inhabitants in 1982, 2 811 inhabitants in 1975 and 2 846 inhabitants in 1968. Meanwhile, the number of housing of Le Chambon-sur-Lignon was 2 064 in 2007, 2 128 in 1999, 2 036 in 1990, 1 951 in 1982, 1 742 in 1975 and 1 690 in 1968.
The number of inhabitants of Le Chambon-sur-Lignon per housing was 1,29 in 2007.
|
Population of Le Chambon-sur-Lignon from 1968 to 2007 :
- Population of Le Chambon-sur-Lignon in 2007 : 2 662 inhabitants
- Population of Le Chambon-sur-Lignon in 1999 : 2 645 inhabitants
- Population of Le Chambon-sur-Lignon in 1990 : 2 854 inhabitants
- Population of Le Chambon-sur-Lignon in 1982 : 2 791 inhabitants
- Population of Le Chambon-sur-Lignon in 1975 : 2 811 inhabitants
- Population of Le Chambon-sur-Lignon in 1968 : 2 846 inhabitants
|
Number of inhabitants per housing of Le Chambon-sur-Lignon :
- Number of inhabitants per housing of Le Chambon-sur-Lignon in 2007 : 1,29
- Number of inhabitants per housing of Le Chambon-sur-Lignon in 1999 : 1,24
- Number of inhabitants per housing of Le Chambon-sur-Lignon in 1990 : 1,40
- Number of inhabitants per housing of Le Chambon-sur-Lignon in 1982 : 1,43
- Number of inhabitants per housing of Le Chambon-sur-Lignon in 1975 : 1,61
- Number of inhabitants per housing of Le Chambon-sur-Lignon in 1968 : 1,68
|
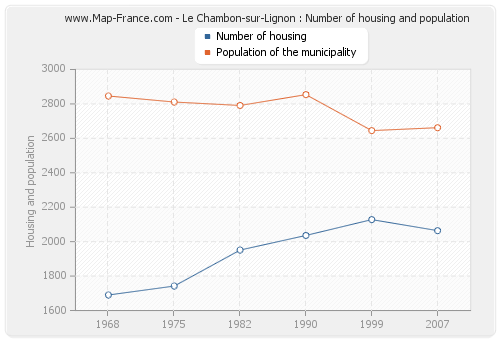
Number of inhabitants and housing of Le Chambon-sur-Lignon
|
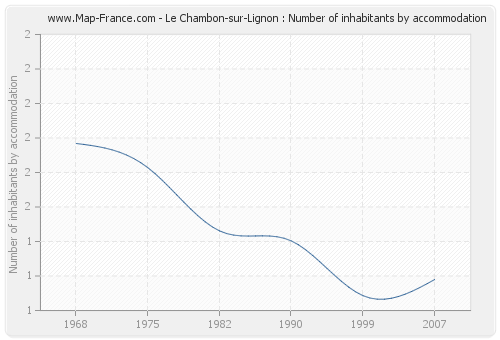
Number of inhabitants per housing of Le Chambon-sur-Lignon
|
Type of accommodation of Le Chambon-sur-Lignon
The accommodation of Le Chambon-sur-Lignon in 2007 consisted of 1 514 houses and 526 flats.
Here are below the graphs presenting the statistics of housing of Le Chambon-sur-Lignon.
|
Type of housing of Le Chambon-sur-Lignon in 2007 :
- Number of houses of Le Chambon-sur-Lignon in 2007 : 1 514
- Number of apartments of Le Chambon-sur-Lignon in 2007 : 526 |
Number of rooms of main homes of Le Chambon-sur-Lignon in 2007 :
- Number of main homes of Le Chambon-sur-Lignon of 1 room : 19
- Number of main homes of Le Chambon-sur-Lignon of 2 rooms : 98
- Number of main homes of Le Chambon-sur-Lignon of 3 rooms : 243
- Number of main homes of Le Chambon-sur-Lignon of 4 rooms : 243
- Number of main homes of Le Chambon-sur-Lignon of 5 rooms and more : 478 |
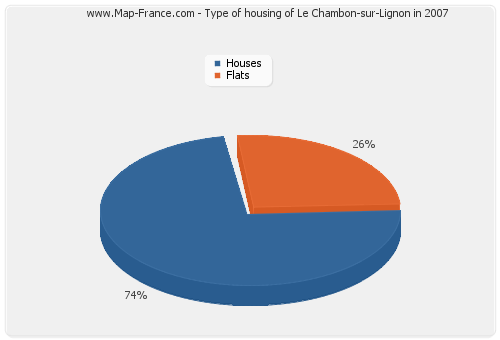
Type of housing of Le Chambon-sur-Lignon in 2007
|
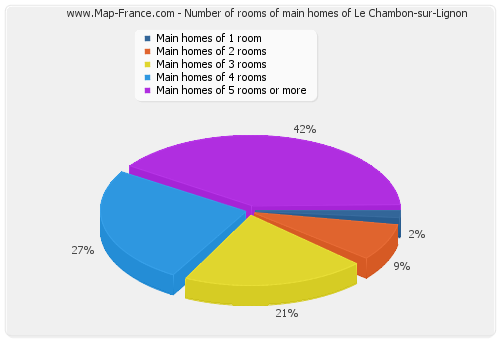
Number of rooms of main homes of Le Chambon-sur-Lignon
|
Type of housing of Le Chambon-sur-Lignon
|
In 2007, 775 main homes of Le Chambon-sur-Lignon were occupied by owners. Meanwhile, 1 148 households lived in the city of Le Chambon-sur-Lignon. The following graphs present the statistics of these households of Le Chambon-sur-Lignon.
|
Moving in date of the households of Le Chambon-sur-Lignon (2007 data):
- Number of households of Le Chambon-sur-Lignon having moved for less than 2 years : 129
- Number of households of Le Chambon-sur-Lignon having moved between 2 and 5 years : 211
- Number of households of Le Chambon-sur-Lignon having moved between 5 and 9 years : 170
- Number of households of Le Chambon-sur-Lignon having moved for 10 years or more : 638 |
Type of housing of the main homes of Le Chambon-sur-Lignon in 2007 :
- Number of main homes of Le Chambon-sur-Lignon occupied by owners : 775
- Number of main homes of Le Chambon-sur-Lignon occupied by tenants : 327
- Number of main homes of Le Chambon-sur-Lignon occupied free of charge : 46 |
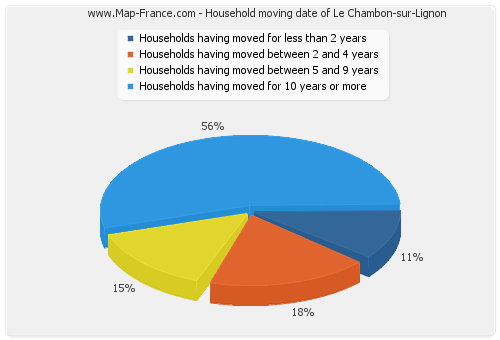
Household moving date of Le Chambon-sur-Lignon
|
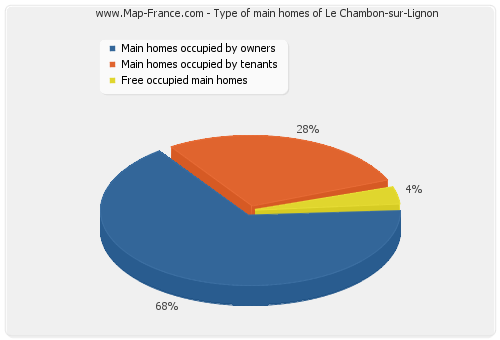
Type of main homes of Le Chambon-sur-Lignon
|
|
